Industrial big data is a brand new concept. Literally, industrial big data refers to big data generated in industrialized information applications.
With the deep integration of informationization and industrialization, information technology has penetrated into all aspects of the industrial chain of industrial enterprises, such as barcodes, QR codes, RFID, industrial sensors, industrial automation systems, industrial Internet of Things, ERP, CAD/CAM/CAE/ Technologies such as CAI are widely used in industrial enterprises, especially the application of new generation information technologies such as the Internet, mobile Internet, and Internet of Things in the industrial field. Industrial enterprises have also entered the new development stage of the Internet industry, and the data owned by industrial enterprises. It is also increasingly rich. In industrial enterprises, the production line is running at a high speed. The amount of data generated, collected and processed by industrial equipment is much larger than that of computers and labor generated by enterprises. From the data type, most of them are unstructured data, and the high-speed operation of the production line is for data. Real-time requirements are also higher. As a result, industrial big data applications face fewer problems and challenges than big data applications in the Internet industry, and in some cases are even more complex.

Industrial big data applications will bring a new era of innovation and change in industrial enterprises. Through low-cost awareness, high-speed mobile connectivity, distributed computing and advanced analytics brought by the Internet, mobile Internet of Things, etc., information technology and global industrial systems are deeply integrated, bringing profound changes to the global industry, innovative enterprise R&D and production. , operations, marketing and management methods. These innovative industrial companies in different industries bring faster speed, higher efficiency and higher insight. Typical applications for industrial big data include product innovation, product fault diagnosis and prediction, industrial production line IoT analysis, industrial enterprise supply chain optimization, and product precision marketing. This article will sort out the application scenarios of industrial big data in manufacturing enterprises.
1. Accelerate product innovation
The interaction and trading behavior between customers and industrial enterprises will generate a large amount of data, mining and analyzing these customer dynamic data, and can help customers participate in innovative activities such as product demand analysis and product design, and contribute to product innovation. Ford is a leader in this area. They apply big data technology to the innovation and optimization of Ford Focus electric vehicles. This car has become a veritable “big data electric carâ€. The first generation of Ford Focus electric vehicles generated a lot of data when driving and parking. While driving, the driver continuously updates the vehicle's acceleration, braking, battery charging and position information. This is useful for drivers, but the data is also passed back to Ford engineers to understand the customer's driving habits, including how, when, and where to charge. Even if the vehicle is at rest, it continues to transmit vehicle tire pressure and battery system data to the nearest smartphone.
This customer-centric big data application scenario has many benefits because big data enables valuable new product innovation and collaboration. Drivers get useful up-to-date information, and engineers in Detroit gather information about driving behavior to understand customers, develop product improvement plans, and implement new product innovations. Moreover, utilities and other third-party vendors can analyze millions of miles of driving data to determine where to build new charging stations and how to prevent fragile grids from overloading.
2. Product fault diagnosis and prediction
This can be used for after-sales service and product improvement. The introduction of ubiquitous sensors and Internet technologies has made real-time diagnosis of product faults a reality, and big data applications, modeling and simulation techniques have made predictive dynamics possible. During the search for the Malaysia Airlines MH370 lost passenger aircraft, Boeing's engine operating data played a key role in determining the aircraft's misalignment path. Let's take Boeing's aircraft system as a case to see how big data applications work in product troubleshooting. On Boeing's aircraft, hundreds of variables, such as the engine, fuel system, hydraulics and power systems, form the in-flight state, which is measured and sent in less than a few microseconds. In the case of the Boeing 737, the engine produces 10 TB of data every 30 minutes in flight.
These data are not only engineering telemetry data that can be analyzed at some point in the future, but also promote real-time adaptive control, fuel usage, part failure prediction and pilot notification, which can effectively diagnose and predict faults. Look at an example of General Electric (GE), the GE Energy Monitoring and Diagnostics (M&D) Center in Atlanta, USA, which collects data on thousands of GE gas turbines in more than 50 countries around the world, collecting 10G of data every day for customers. Analyze constant large data streams from Sensor vibration and temperature signals within the system. These big data analyses will support GE's gas turbine fault diagnosis and warning. Wind turbine manufacturer Vestas also improved the wind turbine layout by cross-analysing weather data and period turbine instrument data, thereby increasing wind turbine power output levels and extending service life.
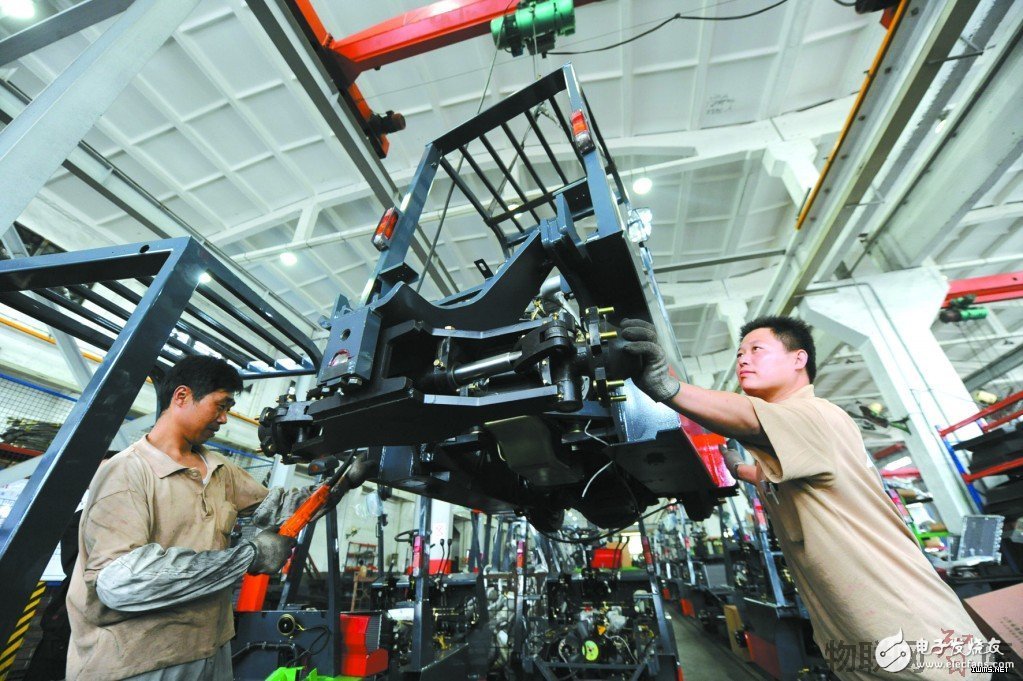
3. Big data application of industrial IoT production line
Modern industrial manufacturing lines are equipped with thousands of small sensors to detect temperature, pressure, heat, vibration and noise. Because data is collected every few seconds, many forms of analysis can be performed using this data, including equipment diagnostics, power usage analysis, energy analysis, and quality incident analysis (including violations of production regulations, component failures). First, in terms of production process improvement, using these big data in the production process, you can analyze the entire production process and understand how each step is performed. Once a process deviates from the standard process, an alarm signal is generated that can more quickly identify errors or bottlenecks and make it easier to solve the problem. Using big data technology, you can also create virtual models of industrial product production processes, simulate and optimize production processes, and when all process and performance data can be rebuilt in the system, this transparency will help manufacturers improve their production processes. . For example, in the aspect of energy consumption analysis, the sensors are used to monitor all the production processes in the production process of the equipment, and the abnormal or peak energy consumption can be found, thereby optimizing the energy consumption in the production process and performing all the processes. Analysis will greatly reduce energy consumption.
4. Analysis and optimization of industrial supply chain
At present, big data analysis has become an important means for many e-commerce companies to enhance the competitiveness of the supply chain. For example, the e-commerce company Jingdong Mall analyzes and predicts the demand for goods in various places in advance through big data, thereby improving the efficiency of distribution and warehousing, and ensuring the customer experience of the next day. RFID and other products such as electronic identification technology, Internet of Things technology and mobile Internet technology can help industrial enterprises to obtain big data in the complete product supply chain. Using this data for analysis will bring about a significant increase in warehousing, distribution, sales efficiency and cost. decline.
Taking Haier as an example, Haier's supply chain system is perfect. It takes the market chain as the link, the order information flow as the center, the movement of animal flow and capital flow, and the integration of global supply chain resources and global user resources. In all aspects of Haier's supply chain, customer data, internal company data, and supplier data are aggregated into the supply chain system. Through the big data collection and analysis in the supply chain, Haier can continue to improve and optimize the supply chain. Haier's agile response to customers. There are more than one thousand OEM suppliers in the United States, providing more than 10,000 different products for manufacturing companies. Each manufacturer relies on market forecasts and other variables such as sales data, market information, trade shows, news, competitors. And even weather forecasts to sell your own products.
Using sales data, sensor data from products, and data from supplier databases, industrial manufacturing companies can accurately predict demand across different regions of the world. Since the inventory and sales price can be tracked, it can be bought when the price falls, so the manufacturing company can save a lot of cost. If you reuse the data generated by the sensors in the product, know what is wrong with the product, and where you need the accessories, they can also predict where and when the parts are needed. This will greatly reduce inventory and optimize the supply chain.
5. Product sales forecast and demand management
Analyze current demand changes and combinations through big data. Big data is a good sales analysis tool. Through the multi-dimensional combination of historical data, we can see the proportion and change of regional demand, the market popularity of product categories, and the most common combination forms, consumer levels, etc. In this way, adjust product strategy and distribution strategy. In some analyses, we can find that the demand for stationery in cities with more colleges and universities in the beginning of the school season will be much higher, so that we can increase the sales of dealers in these cities, attracting them to order more in the opening season, while in the opening season. Capacity planning began in the first month or two to meet promotional needs. For product development, product functions and performance adjustments are made through the focus of the consumer group. For example, a few years ago, people like to use music phones, but now everyone is more inclined to use mobile phones to access the Internet, photo sharing, etc. Trends, 4G mobile phones also occupy a larger market share. Through the analysis of some market details by big data, you can find more potential sales opportunities.
6. Production planning and scheduling
The manufacturing industry faces a multi-variety and small-batch production mode. The data is refined, the automatic and timely collection (MES/DCS) and the variability lead to a sharp increase in data, plus more than ten years of informatized historical data, for the need A fast response to APS is a huge challenge. Big data can give us more detailed data information, find historical prediction and actual deviation probability, consider capacity constraints, personnel skill constraints, material availability constraints, tooling mold constraints, through intelligent optimization algorithms, develop pre-planning scheduling, and monitor Plan the actual deviation from the site, and dynamically adjust the planned scheduling. Help us to avoid the defects of “portraits†and directly impose group characteristics directly on individuals (work center data is directly changed to specific equipment, personnel, molds, etc.). By analyzing and monitoring the data, we can plan for the future. Although big data is a bit embarrassing, big data will become our powerful weapon as long as it is properly applied. At that time, Ford asked what customer needs for big data? The answer is "a faster horse" than a car that is now popular. Therefore, in the world of big data, creativity, intuition, adventurism and knowledge ambition are especially important.
7. Product quality management and analysis
The traditional manufacturing industry is facing the impact of big data. In the aspects of product development, process design, quality management, production and operation, we are eagerly awaiting the birth of innovative methods to deal with the big data challenges in the industrial context. For example, in the semiconductor industry, chips undergo many complex processes such as doping, layering, photolithography, and heat treatment in the production process. Each step must meet extremely demanding physical characteristics. Highly automated equipment is used to process products. At the same time, a large number of test results are also generated simultaneously. Is this massive amount of data the burden of the enterprise or the gold mine of the enterprise? If it is the latter, then how can we quickly find the key reasons for the accurate fluctuation of product yield from the “gold mine� This is a technical problem that has plagued semiconductor engineers for many years.
A wafer produced by a semiconductor technology company will produce a data set containing more than one hundred test items and millions of lines of test records every day after being tested. In accordance with the basic requirements of quality management, an indispensable task is to conduct a process capability analysis for each of the more than one hundred test items with different technical specifications. According to the traditional working mode, we need to calculate more than one hundred process capability indexes step by step, and evaluate each quality characteristic one by one. For the time being, no matter how large or cumbersome the workload is, even if someone can solve the problem of calculation, it is difficult to see the correlation between them from the more than 100 process capability indexes, and it is even more difficult for the overall quality of the product. Performance has a comprehensive understanding and summary. However, if we use the big data quality management analysis platform, in addition to quickly obtaining a long traditional single-index process capability analysis report, more importantly, we can get a lot of new analysis from the same big data set. result.
8. Industrial pollution and environmental protection testing
The most impressive thing about "Under the Dome" is that through the visualization of the report, the Chai Jing team conveys the squalor of the smog problem and the cause of the smog to the audience.

This brings us a revelation that big data is of great value to the environment. Where is the native data of the "Under the Dome" chart? In fact, not all of them are obtained through high-level relationships. Many of the data are publicly available. In the Chinese government network, the websites of various ministries, the official website of Sinopec, the official website of environmental protection organizations, and some special institutions, there are more and more public welfare environmental data that can be queried. Including national air, hydrology and other data, meteorological data, factory distribution and pollution discharge standards and other data. However, these data are too scattered, too professional, lack of analysis, no visualization, and ordinary people cannot understand. If you can understand and keep an eye on it, big data will become an important means for the society to monitor environmental protection. Recently, Baidu’s “National Pollution Monitoring Map†is a very good way. Combined with open environmental big data, Baidu Map has added a pollution detection layer. Anyone can view the country and its own provinces and cities through it. The location information, the name of the organization, the type of emission sources, and the status of pollution discharges announced by the Environmental Protection Agency during the monitoring of emissions agencies under the supervision of the Environmental Protection Agency (including various types of thermal power plants, state-controlled industrial enterprises, and sewage treatment plants). You can view the pollution source closest to you, and there is a reminder. The monitoring point detection items, which exceed the standard, how many times exceed the standard. This information can be shared to the social media platform in real time, to inform friends, to remind everyone to pay attention to the pollution source and personal safety and health.
Summarizing the value potential of industrial big data applications is huge. However, there is still a lot of work to be done to achieve these values. One is the problem of building big data awareness. In the past, there was also such big data, but because there was no awareness of big data, data analysis methods were insufficient. Many real-time data were discarded or shelved, and the potential value of large amounts of data was buried. Another important issue is the problem of data silos. The data of many industrial enterprises is distributed in various islands in the enterprise, especially in large multinational companies. It is quite difficult to extract the data in the whole enterprise. Therefore, an important issue in industrial big data applications is integrated applications.
relay,electric relay,timer relay,general relay,finder relay
Zhejiang Kaimin Electric Co., Ltd. , http://www.ckmineinverter.com