A standard curve refers to a curve consisting of a value of a property of a standard substance of a known composition, thereby obtaining a value of the property. The standard curve is a functional relationship between the physical/chemical properties of the reference material and the instrument response.
In the analytical chemistry experiment, the standard curve method is commonly used for quantitative analysis, and the standard working curve is usually a straight line. Unlike the calibration curve, it is a standard series of standard solutions and media, plotted on a curve. The associated components of the standard series of calibration curves must be matched to the sample for accurate measurement results. The standard curve can be used instead of the calibration curve only if the standard curve coincides with the calibration curve.
Practicality, this is an important prerequisite for making a standard curve; this problem is actually very simple: Can the instrument's instrument response use a standard curve to derive its physical and chemical properties? The answer is based on the specificity of the instrument response and the match between the standard series and the sample. On the one hand, scientific research always strives for the response of the instrument to be the same for the standard and the sample; it also requires the sample to match the standard substrate. In this way, it can be understood that most of the analysis requires the standard curve and the sample to be measured in the same batch (unless the experiment has a small change in the standard curve), it is also understood that the QC test sample should be inserted during the mass inspection to investigate the stability of the instrument. .
Existing methods tend to apply standard curves to a wide range of sample concentrations. In the case of a wide concentration span and a limited standard point, a uniform distribution concentration point is the best choice so that the amount of information provided for all concentrations is the same within the concentration range covered by the standard curve. The setting of the odd points is derived from the known information. First, the range of the concentration is determined. The intermediate point is determined first in the concentration range, and then the symmetric standard curve points are distributed around the intermediate point, so that the number of points is always an odd number.
1. Prepare the corresponding standard series;
2. The absorbance of the series is measured by reference to the blank (or water);
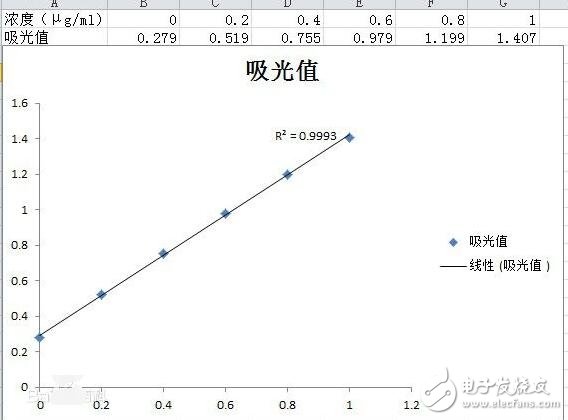
3. The absorbance of the standard solution is taken as the ordinate, and the content of the corresponding standard solution is the abscissa, and the relative points are found;
4. Connect the points with a straight line; try to drop the points on the line; (draw a standard curve;)
5. Finding the relative content based on the measured absorbance of the sample;
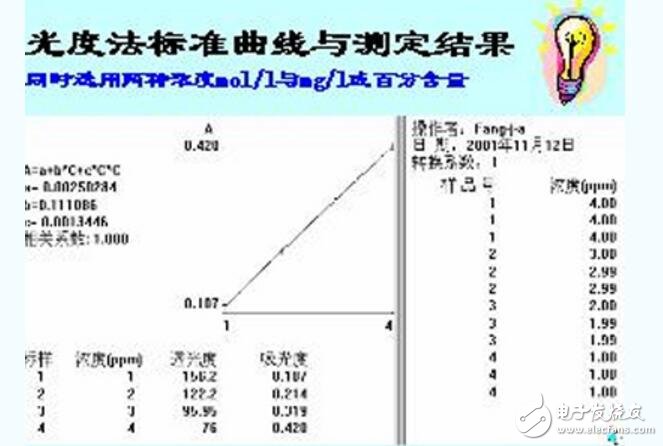
The standard curve is a curve made directly from a standard solution and is a curve used to describe the quantitative relationship between the concentration (or content) of the substance to be measured and the response signal value of the analytical instrument. In the spectrophotometric analysis, the concentration of the measured substance on the instrument has a linear relationship within a certain range, and the result of the water sample measurement can be found from the standard curve. Therefore, the quality of the standard curve will affect the accuracy of the measurement results.
1. The standard curve of the standard curve should be a straight line passing through the origin. If the concentration points on the coordinates are basically on a straight line, the regression process may not be performed. However, in the experiment, there is inevitably a measurement error, and there are often one or two points. Deviation from the straight line, the regression analysis can be performed by the least squares method, then the curve is drawn, usually called the regression line, and the regression line equation is called the regression equation, and the expression is: y=bx+a (where: b is the slope of the line, a is the intercept on the y-axis, x is the concentration of the solution being measured, and y is the absorbance, which is the average of the multiple measurements.
In practice, the purpose of making a standard curve is to use it to find the concentration of the substance in the water sample, instead of using the regression value to obtain the most reliable y value, in order to facilitate the observation of the instrument. The response signal value is substituted into the regression equation to directly calculate the concentration or content of the sample. It is not necessary to draw the standard curve and then find the concentration of the measured object from the curve, and use the following formula to calculate; x=by+a (where: a For the intercept on the x-axis, the other explanation is the same as before).
2. The standard curve of the standard curve has three parameters, namely the correlation coefficient r and the slope b.
The significance of making a standard curve by spectrophotometerThe absorbance values ​​of a series of different solubility standard solutions are respectively measured by a spectrophotometer under a certain wavelength condition, and the absorbance photometric value is the ordinate, and the corresponding solution concentration is the abscissa, and an absorbance can be made on the coordinate paper. A straight line that is proportional to the concentration passing through the origin is called a standard curve. The practical significance of drawing a standard curve is that the corresponding concentration value can be found on the standard curve as long as the absorbance value is measured.
16+ Years Experience Smart Watch manufacturer, ITOPNOO Provide One-stop Smart Wearable devices Solutions For You.
Our Smart Wearable products include android smart watches, Watch For iPhone, Bracelet and Wristband etc.
Leading healthcare navigation services for individuals and families who are generally healthy or face serious medical issues, and health services for employers.
The Trends New Watches Designs. Custom smart watch products designed with the vision of our clients' brands in mind.
Wholesale smart watches,Best Smart Watches,Gifts Wholesalers, smart watch manufacturer
TOPNOTCH INTERNATIONAL GROUP LIMITED , https://www.micbluetooth.com